🦆

Navigation

🧑‍🦯

Defining Your Home

Part 6 - The Automatically Generated Dashboard

says ▶ I use 20x magnification when I code and debug. I use emoji to simplify logs for myself. If you can't handle my code style you can disable most of it on this website by toggling the button in the navbar. Shall duck continue?

Contribute

I'm not really an dashboard kind of guy, but I understand it can have great uses on phone when away.
If you feel like this dashboard is insufficient, feel free to contribute.
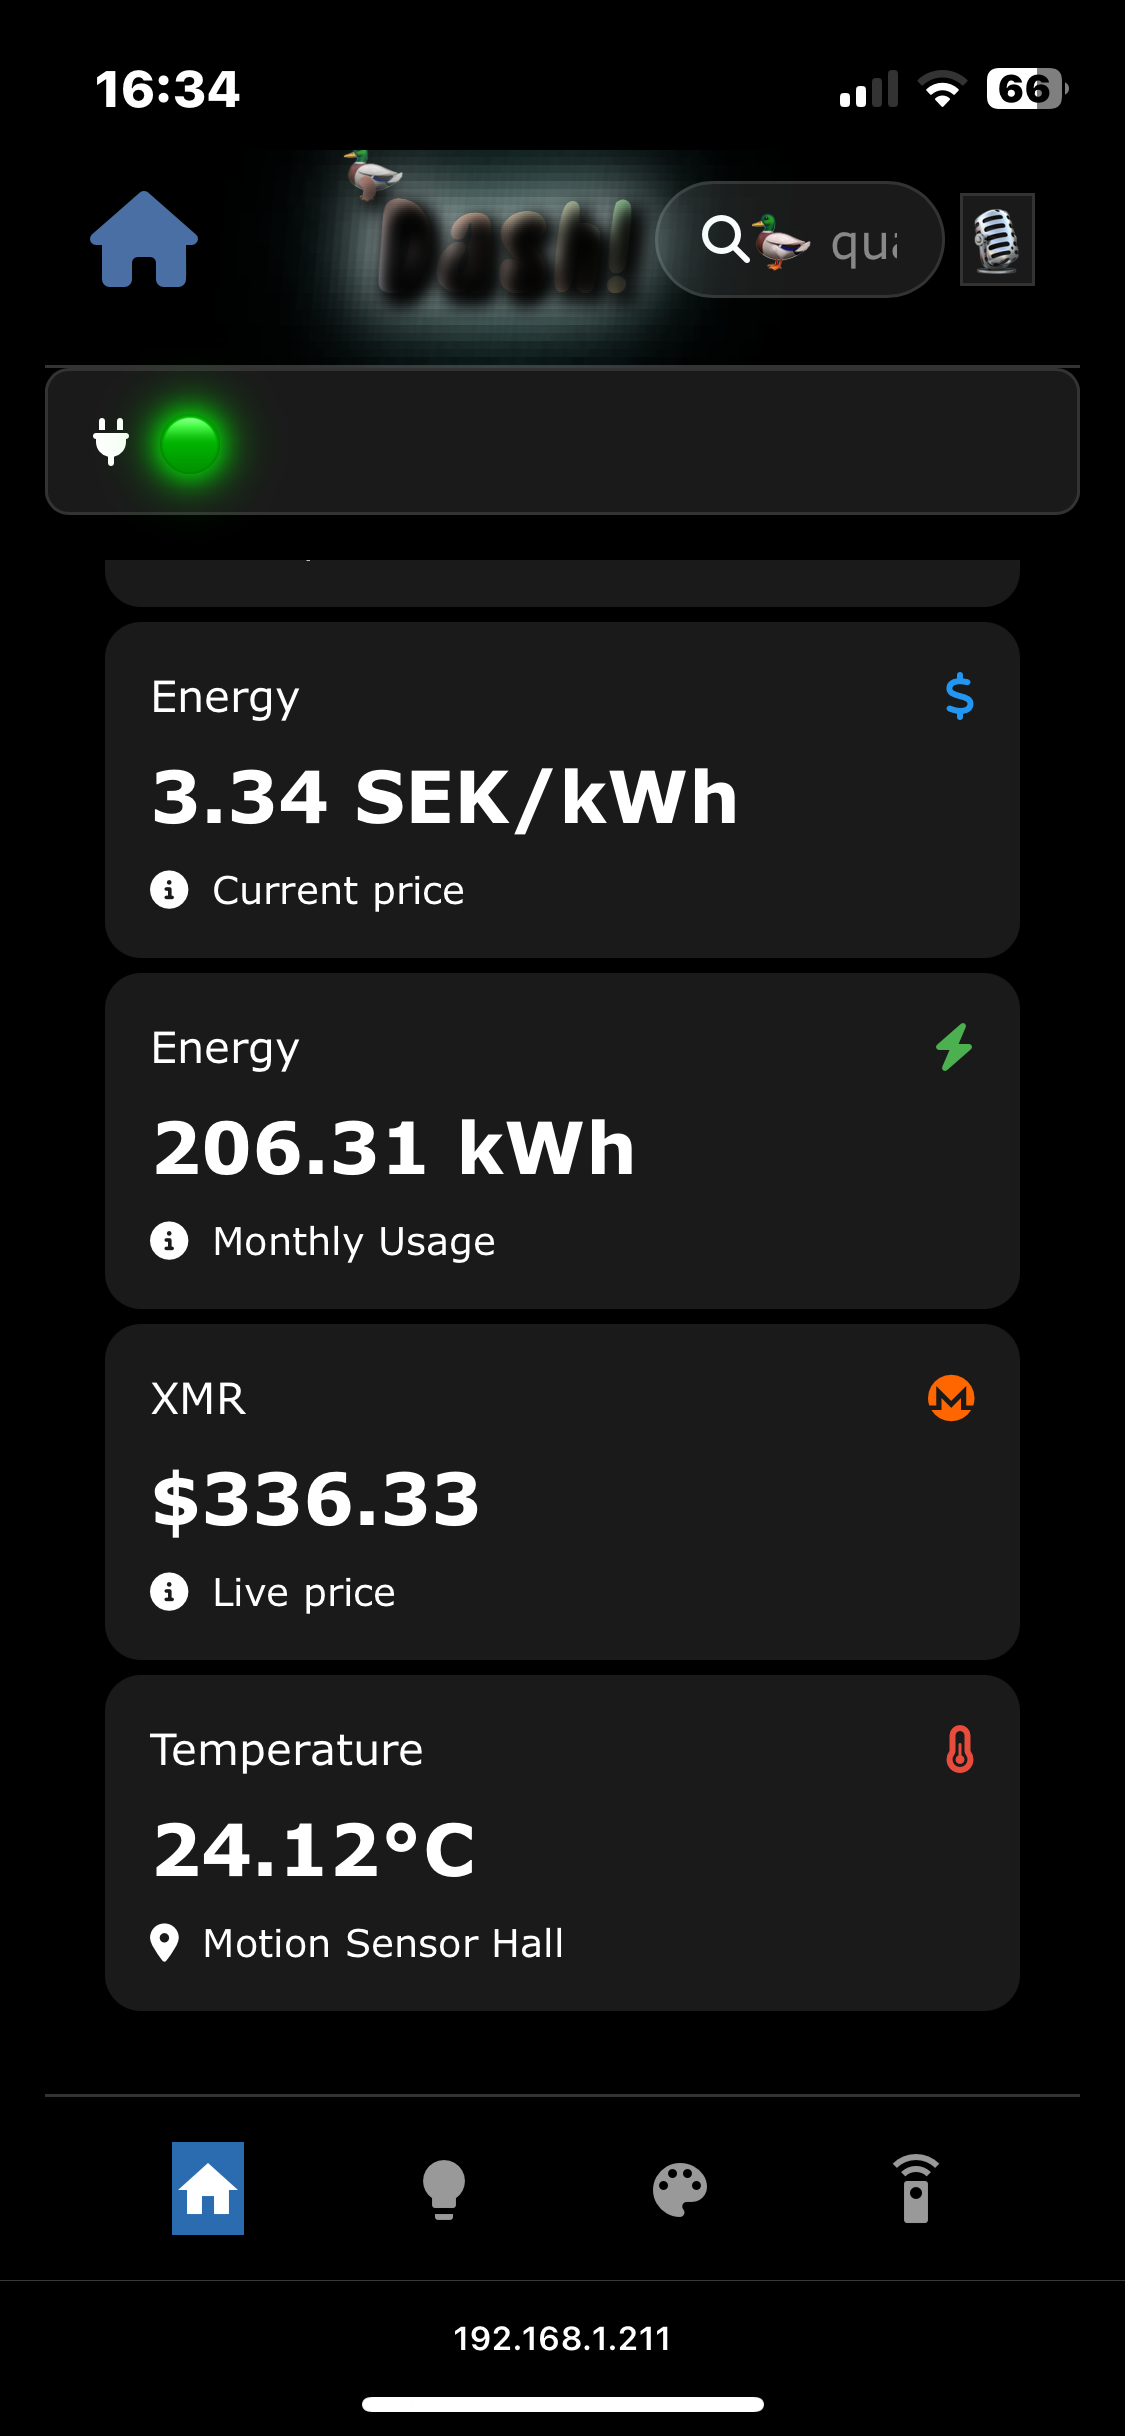
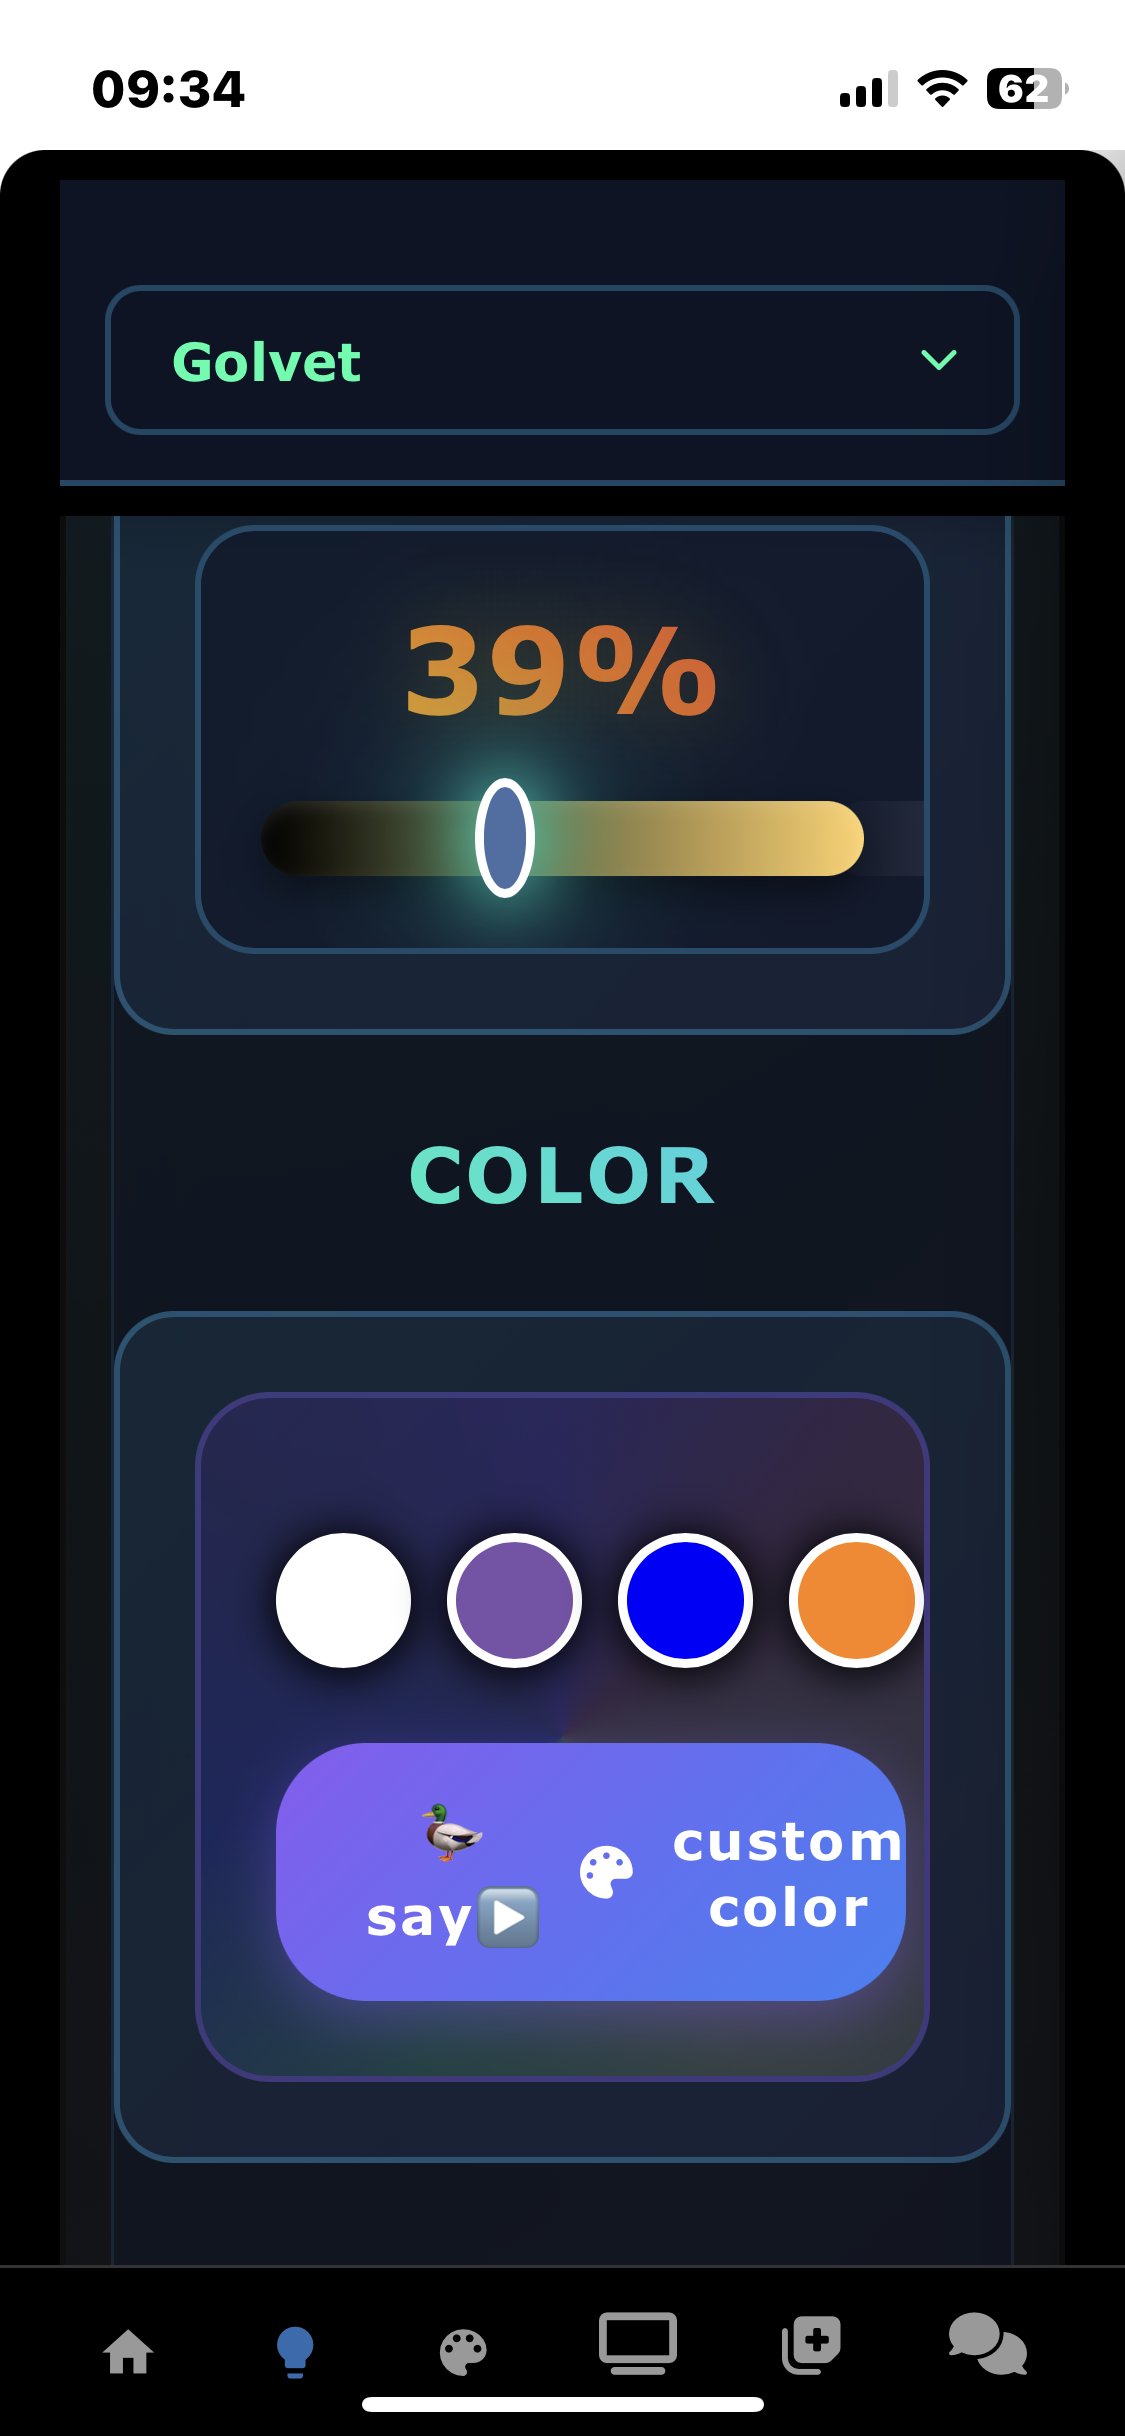
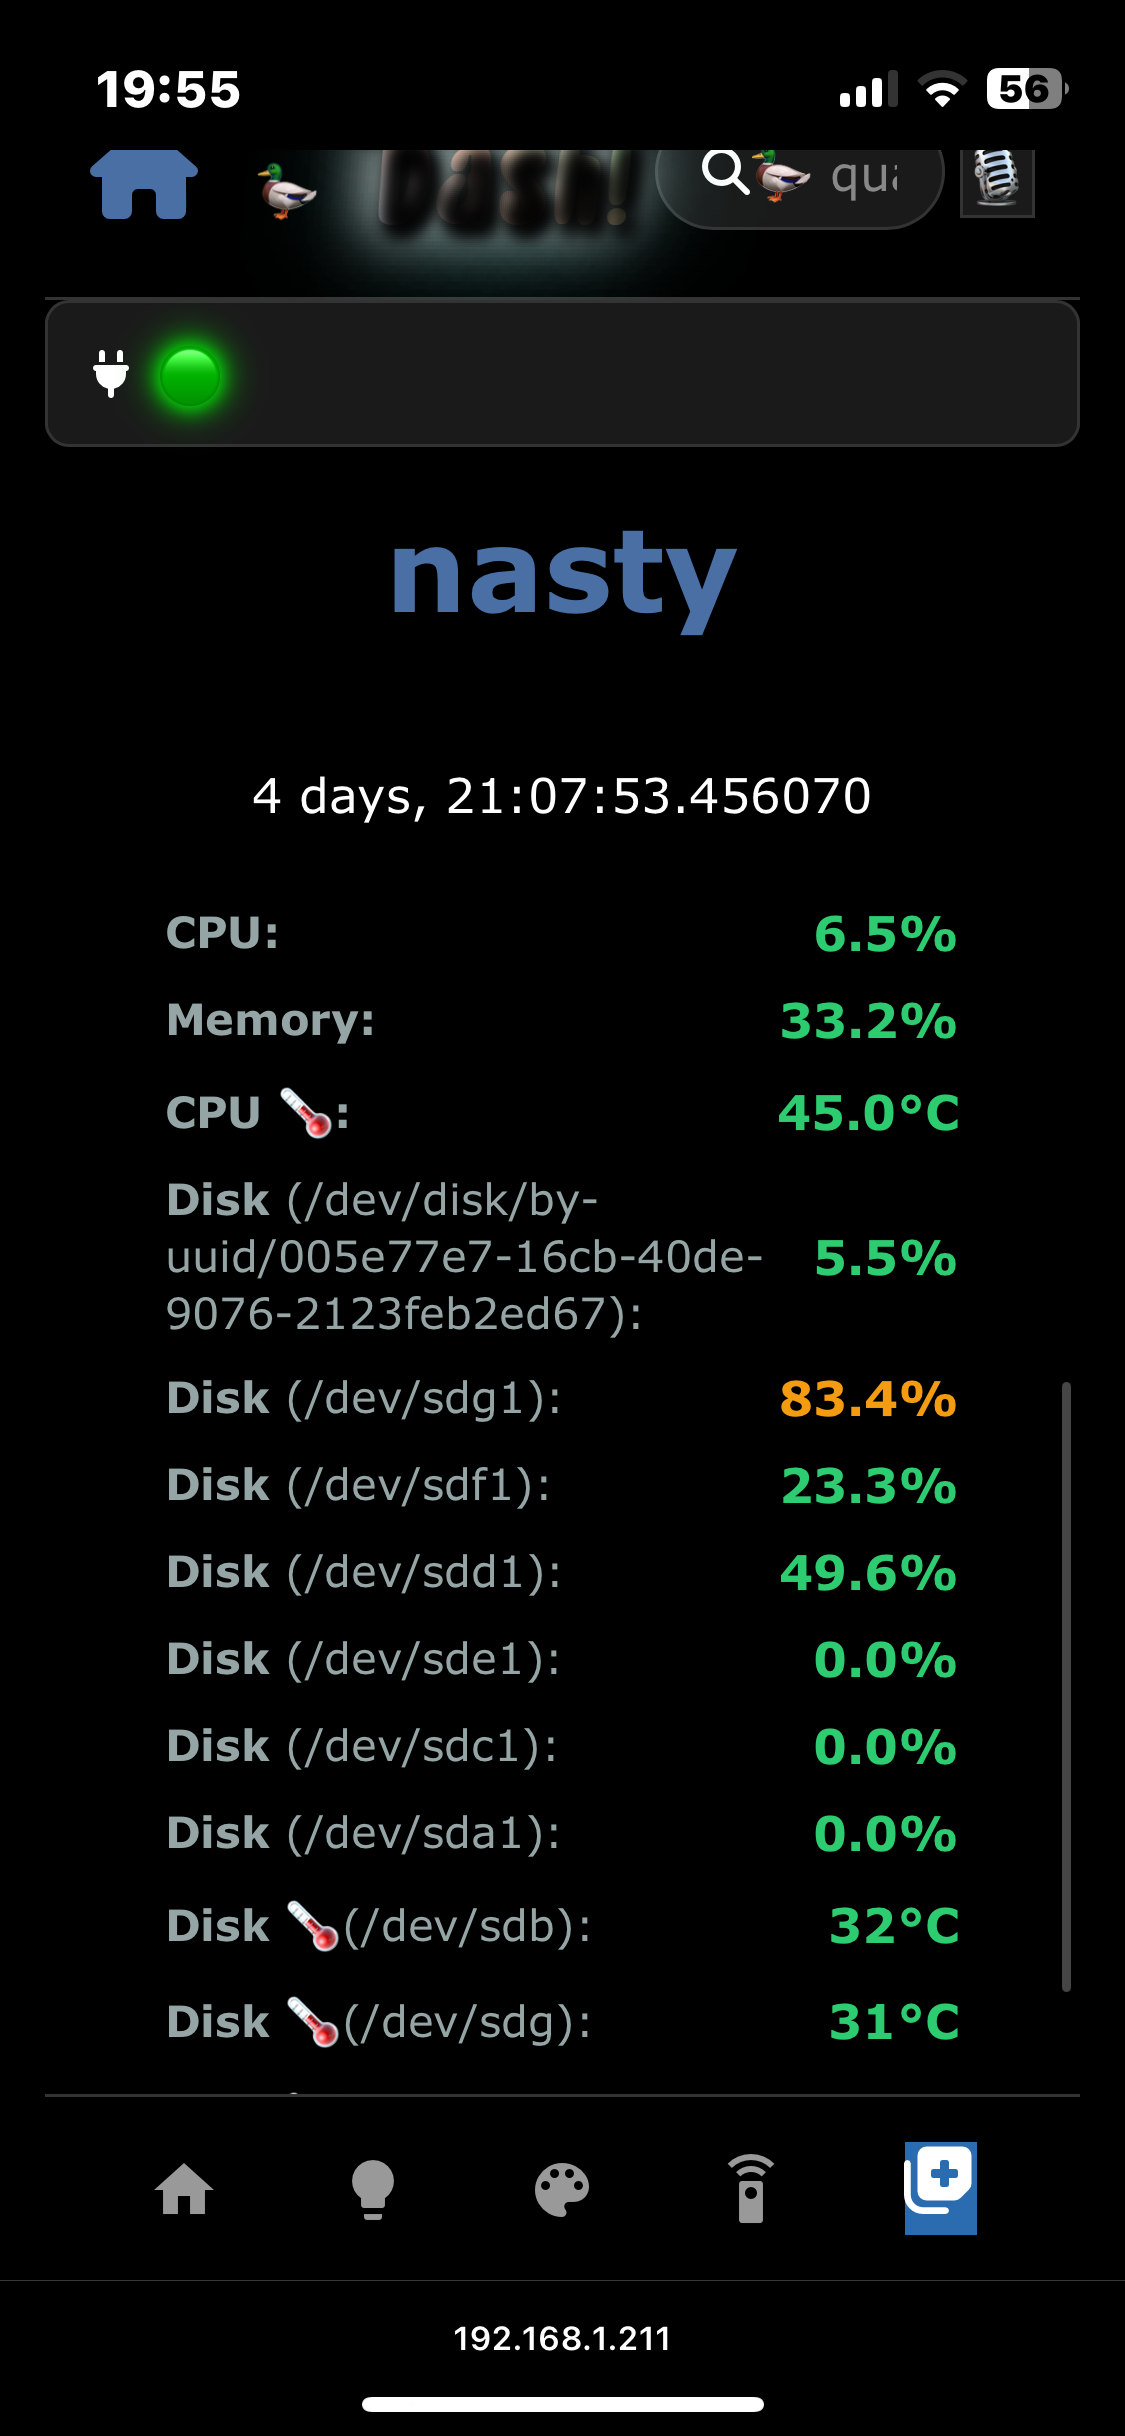
Automagi Dashboard


This is all automatically generated.
Connected to Mosquitto over WebSockets.
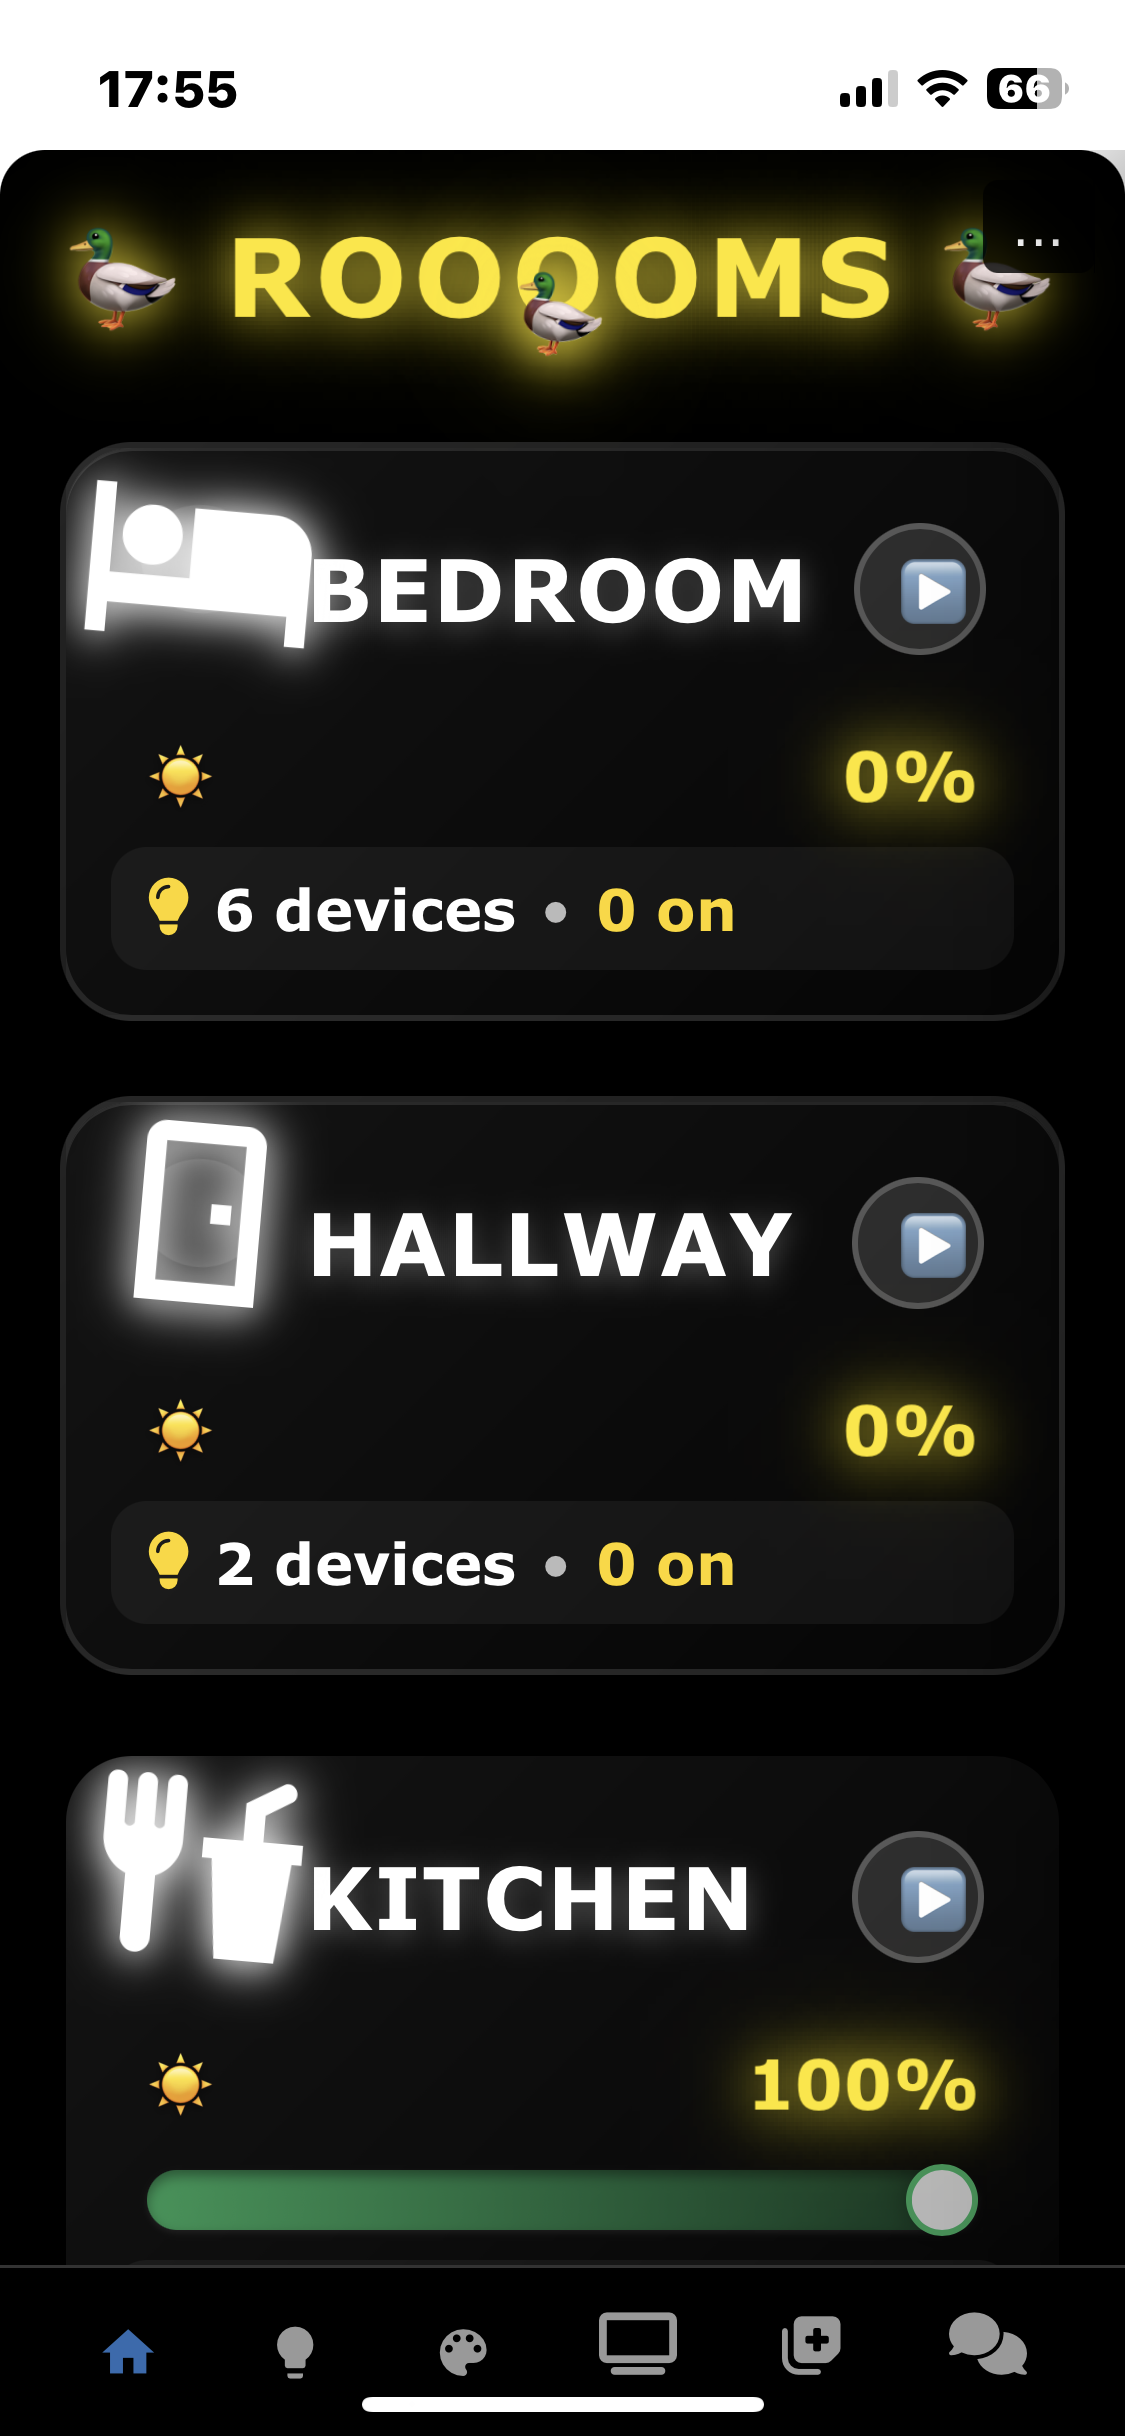
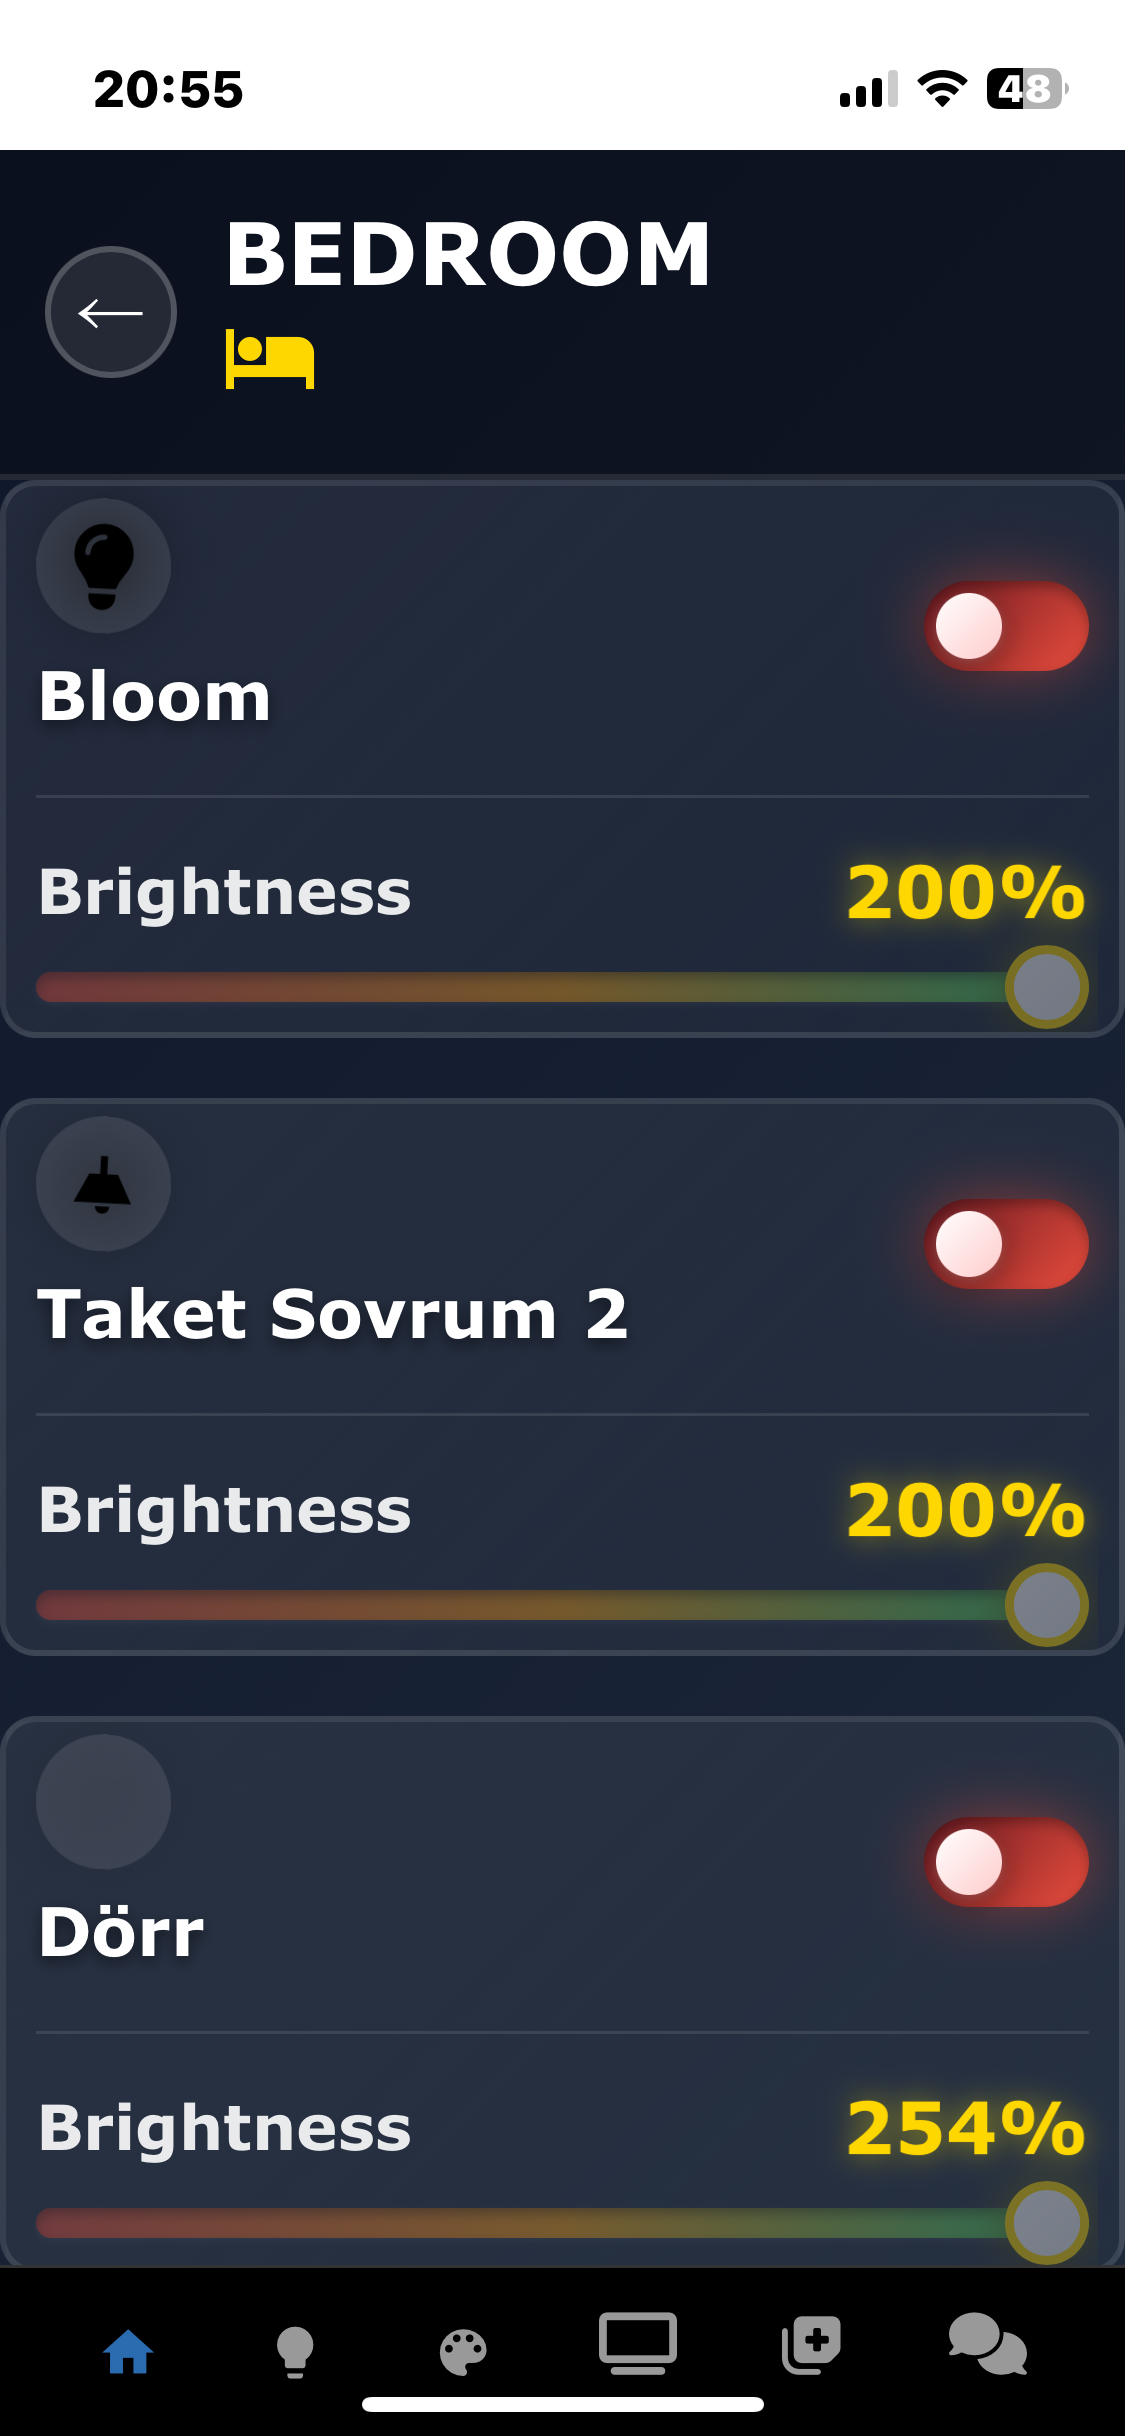
The gradient image for each scene is dynamically fetched from every device's color in the scene.
I think that's my favourite feature in this slimmed dashboard.


It also let's you control defined TV's through a remote page.

Gallery & Video


if any JS yoda wanna help out...


Customizing The Dashboard

The dashboard is extremely modular in the sense that extending it with more pages is as easy as:
▶ View Weather Page Example

  house = {
    dashboard = {
      pages = {
        "4" = {
          icon = "fas fa-cloud-sun";
          title = "Weather";
          code = ''
            hello world
          '';
        };
      };
    };  
  
  };}

Status Cards

The dashboard only comes with one built-in status card, which displays the temperature from your sensors.

Here I am going to show you how easy it is to configure custom status cards for the home page of the dashboard.

For simplicity let's assume you have a energy price script - which data you'd like to publish and display as a status card.
Let's say it looks something like this:
▶ View Message Processing Handler

mqtt_publish \
  -h 192.168.1.111 \ # 🦆says▶ MQTT broker IP
  -u mqtt \ # 🦆says▶ MQTT user
  -p "$(cat /run/secrets/mosquitto)" \ # 🦆says▶ password file
  -t zigbee2mqtt/energy \ # 🦆says▶ MQTT topic
  # 🦆says▶ MQTT message with variable containing the price & usage data
  -m "{\"current_price\": \"$TOTAL\", \"monthly_usage\": \"$TOTAL_KWH\"}"
Now the easiest way of getting that displayed on the dashboard is to use what we already have - Nix automations!
First let's create a mqtt_triggered automation:
▶ View Message Processing Handler

{ # 🦆 says ▶ my house - qwack 
  config,
  lib,
  pkgs,
  ...
} : let
in { # 🦆 duck say ▶ qwack
  house = {
    zigbee = {
      automations = { 
        mqtt_triggered = {
          energy = {
            enable = true;
            description = "Writes energy data to file for dashboard";
            topic = "zigbee2mqtt/energy";
            actions = [
              {
                type = "shell";
                command = ''
                  touch /var/lib/zigduck/energy.json
                  echo "$MQTT_PAYLOAD" > /var/lib/zigduck/energy.json
                '';
              }
            ];
          };     
        };
      };
    };
  
  };}
This simply creates a file containing the mqtt message and saves it as '/var/lib/zigduck/energy.json'.
Basic stuff huh? Let's move on to step two, which is the last and final step.
We're creating a Nix configured status card that reads the file content.
▶ View Message Processing Handler

{ # 🦆 says ▶ my house - qwack 
  config,
  lib,
  pkgs,
  ...
} : let
in { # 🦆 says ▶ qwack
  house = {
    dashboard = {
      statusCards = {
        energy = { # 🦆says▶ name of card
          enable = true;
          title = "Energy"; # 🦆says▶ title that is displayed inside the card
          # 🦆says▶ Font Awesome icon library https://fontawesome.com/icons
          icon = "fas fa-dollar";
          color = "#2196f3"; # 🦆says▶ HEX color for the icon
          filePath = "/var/lib/zigduck/energy.json"; # 🦆says▶ file path to read data from
          # 🦆says▶ since our script had this json field - we read this specific field
          jsonField = "current_price"; 
          # 🦆says▶ format output. {value} is the value of the field we specified above - and i want to display it in SEK/kWh
          format = "{value} SEK/kWh";
          # details = "Current price"; # 🦆says▶ static footer of the card
          # 🦆says▶ or we can read another json field
          detailsJsonField = "monthly_usage";
          detailsFormat = "Usage: {value} kWh";
        };
      };
    };
    
  };}

Give the card a name, title, icon - choose a file path to read json data from, define the key of the data you want to display and you format the output, where {value} show's the actual data.
You can either set a static footer (details) or choose to read another json field from the same file.
This creates a status card that looks like this:


▶ and dat iz it yo! no qwackin' way dat was hard??

Keep adding as many cards as you'd like.
These are the only configurable options for this dashboard as of now, but they do offer good flexibility.
If you have configured everything from earlier steps everything should just work.


Example page

Let's create a service for all our hosts that will ruun a health check every 15th minute and report to our dashboard through a Nix automation.
▶ View System Monitoring Dashboard Page
        
{ # 🦆 says ▶ health checks for all hosts automated into dashboard  
  self,
  lib,
  config,
  pkgs,
  cmdHelpers,
  ... 
} : let   
  # 🦆 says ▶ dis fetch what host has Mosquitto
  sysHosts = lib.attrNames self.nixosConfigurations; 
  mqttHost = lib.findSingle (host:
      let cfg = self.nixosConfigurations.${host}.config;
      in cfg.services.mosquitto.enable or false
    ) null null sysHosts;    
  mqttHostip = if mqttHost != null
    then self.nixosConfigurations.${mqttHost}.config.this.host.ip or (
      let
        resolved = builtins.readFile (pkgs.runCommand "resolve-host" {} ''
          ${pkgs.dnsutils}/bin/host -t A ${mqttHost} > $out
        '');
      in
        lib.lists.head (lib.strings.splitString " " (lib.lists.elemAt (lib.strings.splitString "\n" resolved) 0))
    )
    else (throw "No Mosquitto host found in configuration");

  environment.systemPackages = [  ];  
  pyEnv = pkgs.python3.withPackages (ps: [ ps.psutil ]); 
  

  pyCheck = pkgs.writeScript "pyCheck.py" ''
    #!${pyEnv}/bin/python   
    import subprocess
    import psutil
    import sys
    import time
    import socket
    import os
    import json
    import re
    from datetime import timedelta
    import logging
    
    logging.basicConfig(level=logging.INFO)
    logger = logging.getLogger(__name__)
    
    def get_disk_temperature(disk: str):
        try:
            if disk.startswith('/dev/nvme'):
                cmd = ['sudo', 'nvme', 'smart-log', disk]
                result = subprocess.run(cmd,
                                      stdout=subprocess.PIPE,
                                      stderr=subprocess.PIPE,
                                      text=True,
                                      timeout=5)
                
                if result.returncode != 0:
                    return "failed"
                
                match = re.search(r'Temperature Sensor 1\s*:\s*(\d+)\s*°C', result.stdout)
                return f"{match.group(1)}°C" if match else "N/A"
            
            else:
                cmd = ['sudo', 'smartctl', '-a', disk]
                result = subprocess.run(cmd,
                                      stdout=subprocess.PIPE,
                                      stderr=subprocess.PIPE,
                                      text=True,
                                      timeout=5)
                
                if result.returncode != 0:
                    return "failed"
                
                for line in result.stdout.split('\n'):
                    if 'Temperature_Celsius' in line:
                        parts = line.split()
                        return f"{parts[9]}°C" if len(parts) >= 10 else "N/A"
                return "N/A"
                
        except Exception as e:
            logger.error(f"Temperature error: {str(e)}")
            return "failed"
    
    def get_system_stats():
        stats = {
            "hostname": socket.gethostname(),
            "uptime": str(timedelta(seconds=time.time() - psutil.boot_time())),
            "cpu_usage": psutil.cpu_percent(interval=1),
            "cpu_temperature": "N/A",
            "memory_usage": psutil.virtual_memory().percent,
            "disk_usage": {},
            "disk_temperature": {}
        }
    
        try:
            temps = psutil.sensors_temperatures()
            if 'coretemp' in temps:
                stats["cpu_temperature"] = f"{temps['coretemp'][0].current}°C"
        except Exception as e:
            logger.error(f"CPU temp error: {e}")
    
        disk_temp_cache = {}
        partitions = psutil.disk_partitions()
        
        lsblk_output = subprocess.check_output(
            ['lsblk', '-d', '-n', '-o', 'NAME'],
            text=True
        )
        physical_disks = [f"/dev/{line.strip()}" for line in lsblk_output.split('\n') if line]
    
        for disk in physical_disks:
            disk_temp_cache[disk] = get_disk_temperature(disk)
    
        shown_disks = set()
        for partition in partitions:
            try:
                stats["disk_usage"][partition.device] = f"{psutil.disk_usage(partition.mountpoint).percent}%"
                
                real_device = os.path.realpath(partition.device)
                parent = subprocess.check_output(
                    ['lsblk', '-no', 'pkname', real_device],
                    text=True
                ).strip()
                
                if parent:
                    parent_disk = f"/dev/{parent}"
                    if parent_disk not in shown_disks:
                        stats["disk_temperature"][parent_disk] = disk_temp_cache.get(parent_disk, "N/A")
                        shown_disks.add(parent_disk)
    
            except Exception as e:
                logger.error(f"Disk error: {e}")
                continue
    
        return stats
    
    if __name__ == "__main__":
        print(json.dumps(get_system_stats(), indent=4))
  '';   

  security.sudo.extraRules = [  
    {
      users = [ config.this.user.me.name ];
      commands = [
        {
          command = ${pyCheck};
          options = [ "NOPASSWD" ];
        }
      ];
    }  
  ];
  
  health = lib.mapAttrs (hostName: _: {
    enable = true;
    description = "Health Check: ${hostName}";
    topic = "zigbee2mqtt/health/${hostName}";
    actions = [
      {
         type = "shell";
         command = ''
           mkdir -p /var/lib/zigduck/health
           touch /var/lib/zigduck/health/${hostName}.json
           echo "$MQTT_PAYLOAD" > /var/lib/zigduck/health/${hostName}.json
        '';
       }
     ];
  }) self.nixosConfigurations;
    
in {   
  services.udev.packages = [ pkgs.nvme-cli pkgs.smartmontools ];
  environment.systemPackages = with pkgs; [ nvme-cli smartmontools util-linux ];
   
  yo.scripts.health = {
    description = "Health check and reporting across your machines. Returns JSON structured responses.";
    category = "🧹 Maintenance";  
    aliases = [ "hc" ];
    runEvery = "15"; # 🦆15min
    code = ''
      ${cmdHelpers}            
      MQTT_BROKER="${mqttHostip}"
      MQTT_USER="${config.house.zigbee.mosquitto.username}"
      MQTT_PASSWORD=$(cat "${config.house.zigbee.mosquitto.passwordFile}")
      HC="$(sudo ${pyCheck})"
      mqtt_pub -t "zigbee2mqtt/health/${config.this.host.hostname}" -m "$HC"
    ''; 
  };

  house = {
    # 🦆 says ▶ DASHBOARD CONFIOGURATION 
    dashboard = {
      pages = {
        "4" = {
          icon = "fas fa-notes-medical";
          title = "health";
          files = { health = "/var/lib/zigduck/health"; };
          css = ''
            .health-page .container,
            .health-page .content,
            .health-page > div {
              width: 100% !important;
              max-width: 100% !important;
              margin: 0 !important;
              padding: 0 !important;
            }
            .page[data-page] {
              width: 100% !important;
              max-width: 100% !important;
            }
            .health-page {
              max-width: 1200px;
              margin: 0 auto;
              padding: 20px;
            }       
            .health-grid {
              display: grid;
              grid-template-columns: repeat(auto-fit, minmax(300px, 1fr));
              gap: 15px;
              justify-items: center;
            }        
            .health-card {
              background: var(--card-bg);
              border-radius: 12px;
              padding: 20px;
              box-shadow: var(--card-shadow);
              width: 100%;
              max-width: 350px;
            }     
            .health-card-header {
              display: flex;
              justify-content: space-between;
              align-items: center;
              margin-bottom: 15px;
              border-bottom: 1px solid var(--border-color);
              padding-bottom: 10px;
              flex-direction: column;
              text-align: center;
              gap: 10px;
            }
            .health-hostname {
              font-size: 1.2rem;
              font-weight: bold;
              color: var(--primary);
            }     
            .health-status {
              display: grid;
              gap: 8px;
            }    
            .health-item {
              display: flex;
              justify-content: space-between;
              align-items: center;
            }   
            .health-label {
              color: var(--gray);
              font-size: 0.9rem;
            }        
            .health-value {
              font-weight: 600;
            } 
            .status-good { color: #2ecc71; }
            .status-warning { color: #f39c12; }
            .status-critical { color: #e74c3c; }
            
            @media (max-width: 768px) {
              .health-page {
                padding: 10px;
              }
              
              .health-grid {
                grid-template-columns: 1fr;
                gap: 10px;
              }
              
              .health-card {
                max-width: 100%;
              }
            }           
          '';
          code = ''
            

Machines Health

''; }; }; }; automations = { mqtt_triggered = { // heallth }; }; };


This creates a page for the dashboard with system monitoring data that automatically updates without hardcoding any hostnames.


Source Code


View source code on GitHub

Keep Reading

Part 1. The module, the options and defining devices
Part 2. Configure your Mosquitto/Z2MQTT
Part 3. Nix Configured Automations
Part 4. Writing a Server Service - in Rust
Part 5. Writing a Client - With Voice Commands
Part 6. The Auto-Generated Dashboard◀🦆here u are
Part 7. Let's Build a ChatBot!


Comments on this blog post